Market Outlook
October 19, 2016
Market Cues
Domestic Indices
Chg (%)
(Pts)
(Close)
Indian markets are likely to open positive tracking Asian markets and SGX Nifty.
BSE Sensex
1.9
521
28,051
Nifty
1.8
158
8,678
U.S. markets closed solidly higher on Wall Street after several companies delivered
Mid Cap
1.9
252
13,544
positive surprises in their quarterly earnings reports.
Small Cap
1.3
171
13,279
European markets ended Tuesday's session solidly in positive territory, following
Bankex
2.4
517
22,343
yesterday's pullback. Basic resources, including energy and mining stocks, turned in
a strong performance as commodity prices rebounded. A weakening of the U.S.
Global Indices
Chg (%)
(Pts)
(Close)
dollar drove commodity prices higher, with crude oil prices rising back to around
$50 a barrel.
Dow Jones
0.4
76
18,162
Nasdaq
0.8
44
5,244
Indian markets rallied sharply on Tuesday, with a pullback in the U.S. dollar in
international markets, expectations of positive outcome from the GST Council
FTSE
0.8
53
7,000
meeting and hopes of some NPA resolution for banks following the $13-billion asset
Nikkei
0.4
63
16,964
sale by Essar Oil for paring debt, aiding investor sentiment.
Hang Seng
1.5
357
23,394
Shanghai Com
1.4
43
3,084
News Analysis
Hatsun Agro to invest `850cr till end of next fiscal year
Advances / Declines
BSE
NSE
Detailed analysis on Pg2
Advances
1,911
1,216
Investor’s Ready Reckoner
Declines
943
432
Key Domestic & Global Indicators
Unchanged
204
66
Stock Watch: Latest investment recommendations on 150+ stocks
Refer Pg6 onwards
Volumes (` Cr)
BSE
3,704
Top Picks
CMP
Target
Upside
NSE
21,931
Company
Sector
Rating
(`)
(`)
(%)
Amara Raja Batteries Auto & Auto Ancill.
Buy
1,043
1,218
16.8
Net Inflows (` Cr)
Net
Mtd
Ytd
HCL Tech
IT
Buy
834
1,000
19.9
Bharat Electronics
Capital Goods
Accumulate
1,282
1,414
10.3
FII
(220)
(801)
49,203
Equitas Holdings
Financials
Buy
179
235
31.0
MFs
529
2,796
16,742
Navkar Corporation Others
Buy
199
265
33.1
More Top Picks on Pg4
Top Gainers
Price (`)
Chg (%)
Key Upcoming Events
Hcc
38
9.9
Previous
Consensus
Date
Region
Event Description
Aloktext
4
8.5
Reading
Expectations
Oct 19 UK
CPI (YoY)
0.60
0.90
Adaniports
267
6.3
Oct 19 US
Housing Starts
1,142.00
1,175.00
Sparc
332
6.3
Oct 19 UK
Jobless claims change
2.40
3.15
Lichsgfin
613
6.1
Oct 19 China
Industrial Production (YoY)
6.30
6.40
Oct 19 China
Real GDP (YoY)
6.70
6.70
Top Losers
Price (`)
Chg (%)
Oct 20 US
Initial Jobless claims
246.00
250.00
Mindtree
477
(2.9)
Oct 20 US
Existing home sales
5.33
5.35
Oct 20 Euro Zone
ECB announces interest rates
-
-
Wabag
538
(2.9)
Oct 21 Euro Zone
Euro-Zone Consumer Confidence
(8.20)
(8.00)
Aiaeng
1,261
(2.4)
Oct 24 Germany
PMI Services
50.90
Ramcocem
636
(2.3)
Oct 24 Germany
PMI Manufacturing
54.30
6.(
Prestige
195
(2.2)
More Events on Pg5
As on October 18, 2016
Market Outlook
October 19, 2016
News Analysis
Hatsun Agro to invest `850cr till end of next fiscal year
Hatsun Agro Product Ltd is planning to invest around `850cr during the current
fiscal year and next fiscal year, in order to set up two milk processing facilities,
along with expansion of existing facilities and marketing.
As per the company, it has been growing at 18% compounded annual growth rate
(CAGR) in the last five years and it is expecting to maintain the same level of
growth for the next three fiscal years, due to penetration into new markets.
It is planning to set up a milk and curd processing unit at Dharapuram, Tamil
Nadu and another one near Ongole, Andhra Pradesh, as part of capacity
expansion before March 2018. The growth in milk augmentation will mostly
happen in the new areas of Andhra Pradesh, Telengana and Maharashtra apart
from further penetration in Tamil Nadu and Karnataka. It is also looking at more
active bulk coolers and milk collection centres to be established during current and
next fiscal year.
The company plans to install about 22 MW of windmills by January, 2017, to have
around 80 per cent captive power usage. It is also planning to shift cattle feed
manufacturing, which is currently around 4,000 tonne a month from third party
manufacturing to its own facility in Palani, Tamil Nadu, with a capacity of 15,000
tonne a month. The facility will start production from the beginning of November.
Hansun Agro has invested around `310cr from 2014-15, which has helped it to
mark a growth of 18%. With the fresh investments, the company is expecting to
continue the growth momentum, though the industry is anticipated to grow at
around six per cent in the next three fiscal years.
Economic and Political News
Panel discusses GST rate; reaches consensus on compensation
Cabinet may consider Budget presentation on February 1, 2017
RBI to cut rates in early 2017, aided by low inflation: Reuters poll
Corporate News
Apollo arm plans to raise `450cr to double clinics in 3 years
RIL plans shutdown of FCCU in DTA unit of Jamnagar refinery for
maintenance
Nalco's aluminum sales up 6% in Apr-Sept
Market Outlook
October 19, 2016
Quarterly Bloomberg Brokers Consensus Estimate
LIC Housing Finance Ltd - October 20, 2016
Particulars (` cr)
2QFY17E
2QFY16
y-o-y (%)
1QFY17 q-o-q (%)
Net profit
455
412
10.6
408
11.6
ACC Ltd - Oct 21, 2016
Particulars (` cr)
3QCY16E
3QCY15
y-o-y (%)
2QCY16 q-o-q (%)
Net sales
3,033
2,740
10.7
2,870
5.7
EBITDA
451
314
43.7
457
(1.3)
EBITDA margin (%)
14.9
11.4
15.9
Net profit
245
117
109.7
238
3.2
Wipro Ltd Consol - Oct 21, 2016
Particulars (` cr)
2QFY17E
2QFY16
y-o-y (%)
1QFY17 q-o-q (%)
Net sales
13,788
12,514
10.2
13,599
1.4
EBITDA
2,811
2,729
3.0
2,653
6.0
EBITDA margin (%)
20.4
21.8
19.5
Net profit
2,168
2,241
(3.2)
2,052
5.7
Market Outlook
October 19, 2016
Top Picks ★★★★★
Large Cap
Market Cap
CMP
Target
Upside
Company
Rationale
(` Cr)
(`)
(`)
(%)
To outpace battery industry growth due to better technological
Amara Raja Batteries
17,817
1,043
1,218
16.8
products leading to market share gains in both the
automotive OEM and replacement segments.
Uptick in defense capex by government when coupled with
Bharat Electronics
23,848
84
111
32.5
BELs strong market positioning, indicate that good times are
ahead for BEL.
The stock is trading at attractive valuations and is factoring all
HCL Tech
30,762
1,282
1,414
10.3
the bad news.
Back on the growth trend, expect a long term growth of 14%
Infosys
1,17,692
834
1,000
19.9
to be a US$20bn in FY2020.
Source: Company, Angel Research
Mid Cap
Market Cap
CMP
Target
Upside
Company
Rationale
(` Cr)
(`)
(`)
(%)
We expect the company would report strong profitability
Asian Granito
834
277
351
26.6
owing to better product mix, higher B2C sales and
amalgamation synergy.
Among the top 4 players in the consumer durables segment.
Bajaj Electricals
2,601
257
306
18.9
Improved profitability backed by turn around in E&P
segment. Strong order book lends earnings visibility.
Favourable outlook for the AC industry to augur well for
Cooling products business which is out pacing the market
Blue Star
5,371
563
634
12.6
growth. EMPPAC division's profitability to improve once
operating environment turns around.
With a focus on the low and medium income (LMI) consumer
Dewan Housing Finance
9,456
324
350
8.0
segment, the company has increased its presence in tier-II &
III cities where the growth opportunity is immense.
Strong loan growth backed by diversified loan portfolio and
adequate CAR. ROE & ROA likely to remain decent as risk of
Equitas Holdings
6,015
179
235
31.0
dilution remains low. Attractive valuations considering
growth.
Economic recovery to have favourable impact on advertising
& circulation revenue growth. Further, the acquisition of a
Jagran Prakashan
6,488
198
225
13.4
radio business (Radio City) would also boost the company's
revenue growth.
Speedier execution and speedier sales, strong revenue
Mahindra Lifespace
1,794
437
522
19.4
visibilty in short-to-long run, attractive valuations
We expect the company to report strong growth on back of
healthy growth in domestic branded sales (owing to
Mirza International
1,131
94
113
20.1
aggressive ad spend and addition in the number of EBOs &
multi-brand outlets [MBOs]) and healthy export revenues.
Massive capacity expansion along with rail advantage at ICD
Navkar Corporation
2,840
199
265
33.1
as well CFS augurs well for the company.
Strong brands and distribution network would boost growth
Siyaram Silk Mills
1,435
1,531
1,714
12.0
going ahead. Stock currently trades at an inexpensive
valuation.
Market leadership in Hindi news genre and no. 2 viewership
ranking in English news genre, exit from the radio business,
TV Today Network
1,969
330
363
10.0
and anticipated growth in ad spends by corporates to benefit
the stock.
Source: Company, Angel Research
Market Outlook
October 19, 2016
Key Upcoming Events
Result Calendar
Date
Company
October 19, 2016 KPIT Cummins, NIIT, Hind. Zinc
October 20, 2016 LIC Housing Fin.
October 21, 2016 ACC, Wipro, Mindtree, Cairn India, Kirloskar Engines India Ltd
October 22, 2016 Persistent, L G Balakrishnan & Bros
October 24, 2016 Axis Bank
October 25, 2016 HDFC Bank, Kotak Mah. Bank, Asian Paints, Dr Reddy's
October 26, 2016 Exide Industries, LMW, HDFC, Dabur India, Cadila Healthcare, Indoco Remedies
Source: Bloomberg, Angel Research
Global economic events release calendar
Bloomberg Data
Date
Time
Country Event Description
Unit
Period
Last Reported Estimated
Oct 19, 2016
2:00 PM
UK
CPI (YoY)
% Change Sep
0.60
0.90
6:00 PM
US
Housing Starts
Thousands Sep
1,142.00
1,175.00
2:00 PM
UK
Jobless claims change
% Change Sep
2.40
3.15
7:30 AM
China
Industrial Production (YoY)
% Change Sep
6.30
6.40
7:30 AM
China
Real GDP (YoY)
% Change 3Q
6.70
6.70
Oct 20, 2016
6:00 PM
US
Initial Jobless claims
Thousands Oct 15
246.00
250.00
7:30 PM
US
Existing home sales
Million
Sep
5.33
5.35
5:15 PM Euro Zone
ECB announces interest rates
% Oct 20
-
-
Oct 21, 2016
7:30 PM Euro ZoneEuro-Zone Consumer Confidence
Value Oct A
(8.20)
(8.00)
Oct 24, 2016
1:00 PM Germany
PMI Services
Value Oct P
50.90
1:00 PM Germany
PMI Manufacturing
Value Oct P
54.30
Oct 25, 2016
7:30 PM
US
New home sales
Thousands Sep
609.00
604.00
Oct 26, 2016
7:30 PM
US
Consumer Confidence S.A./ 1985=100 Oct
104.10
100.50
Oct 27, 2016
2:00 PM
UK
GDP (YoY)
% Change 3Q A
2.10
Oct 31, 2016
3:30 PM Euro Zone
Euro-Zone GDP s.a. (QoQ)
% Change 3Q A
0.30
Nov 01, 2016
3:30 PM Euro Zone
Euro-Zone GDP s.a. (QoQ)
% Change 3Q A
0.30
6:30 AM
China
PMI Manufacturing
Value
Oct
50.40
Source: Bloomberg, Angel Research
Market Outlook
October 19, 2016
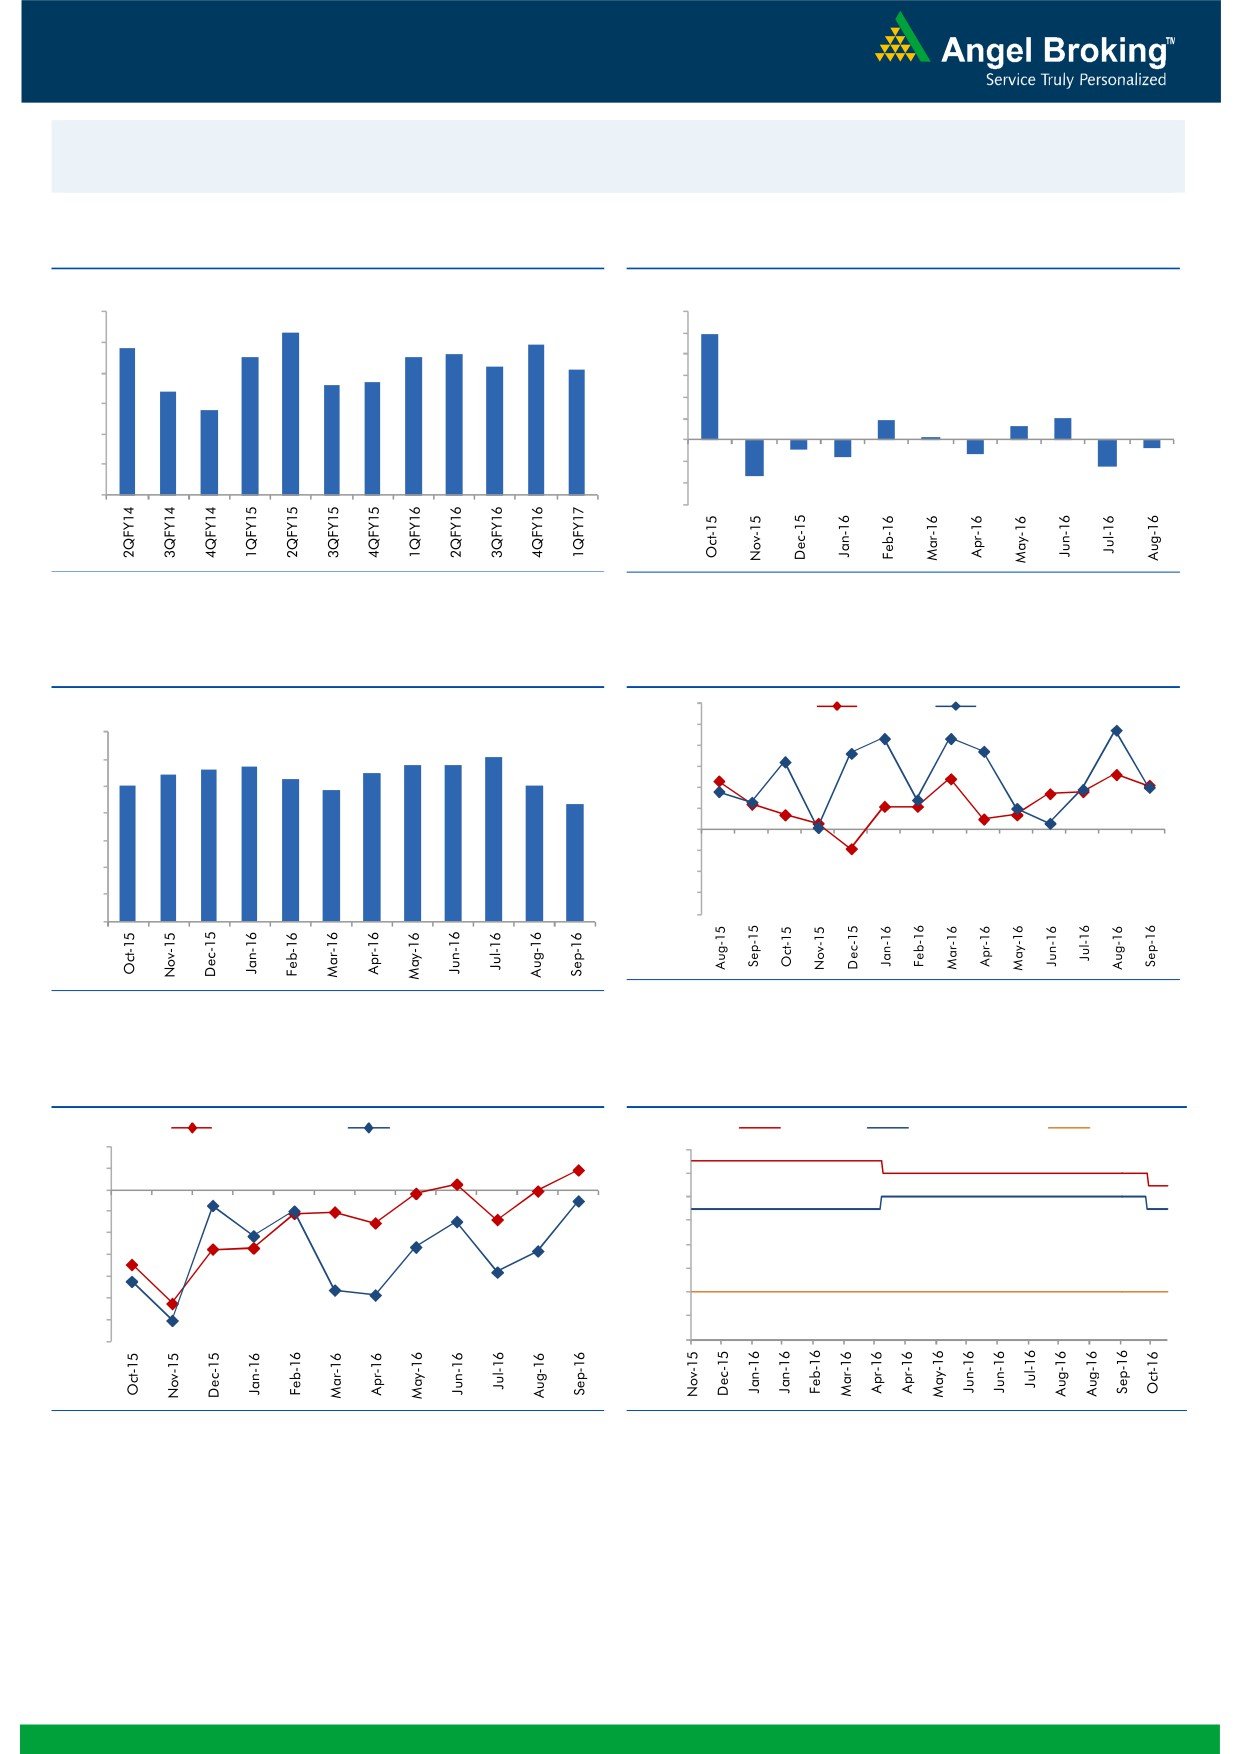
Macro watch
Exhibit 1: Quarterly GDP trends
Exhibit 2: IIP trends
(%)
(%)
9.0
8.3
12.0
9.9
7.8
7.9
10.0
8.0
7.5
7.5
7.6
7.2
7.1
8.0
6.6
6.7
7.0
6.4
6.0
5.8
6.0
4.0
1.9
2.0
1.3
2.0
0.3
5.0
-
4.0
(2.0)
(0.7)
(0.9)
(1.6)
(1.3)
(4.0)
(2.5)
3.0
(3.4)
(6.0)
Source: CSO, Angel Research
Source: MOSPI, Angel Research
Exhibit 3: Monthly CPI inflation trends
Exhibit 4: Manufacturing and services PMI
56.0
Mfg. PMI
Services PMI
(%)
55.0
7.0
6.1
5.7
5.8
5.8
54.0
5.6
5.5
6.0
5.4
5.3
5.0
5.1
53.0
4.8
5.0
4.3
52.0
4.0
51.0
50.0
3.0
49.0
2.0
48.0
1.0
47.0
46.0
-
Source: Market, Angel Research; Note: Level above 50 indicates expansion
Source: MOSPI, Angel Research
Exhibit 5: Exports and imports growth trends
Exhibit 6: Key policy rates
(%)
Exports yoy growth
Imports yoy growth
(%)
Repo rate
Reverse Repo rate
CRR
10.0
7.00
5.0
6.50
0.0
6.00
(5.0)
5.50
(10.0)
5.00
(15.0)
4.50
(20.0)
4.00
(25.0)
(30.0)
3.50
(35.0)
3.00
Source: Bloomberg, Angel Research
Source: RBI, Angel Research
Market Outlook
October 19, 2016
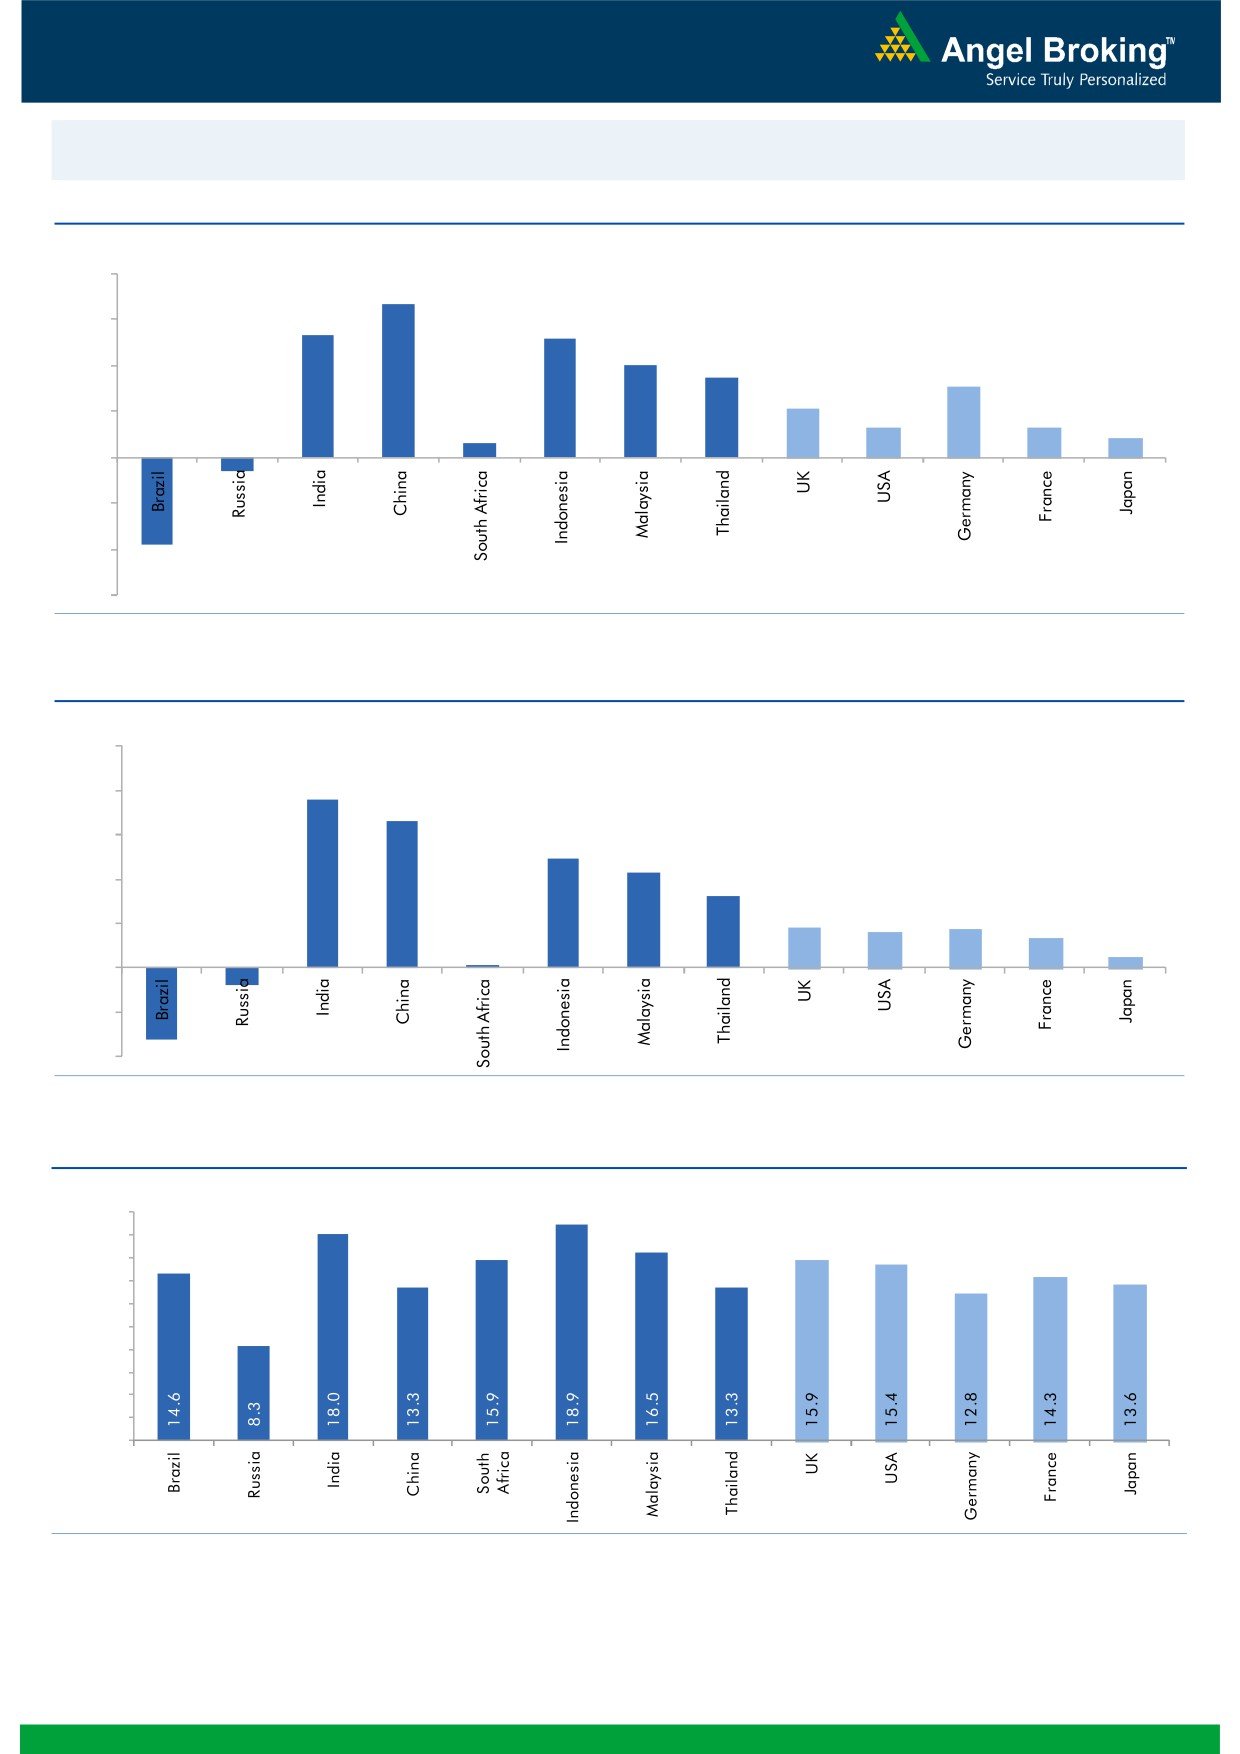
Global watch
Exhibit 1: Latest quarterly GDP Growth (%, yoy) across select developing and developed countries
(%)
8.0
6.7
6.0
5.3
0.6
5.2
4.0
3.5
4.0
3.1
2.1
2.0
1.3
1.3
0.8
-
(2.0)
(0.6)
(4.0)
(3.8)
(6.0)
Source: Bloomberg, Angel Research
Exhibit 2: 2016 GDP Growth projection by IMF (%, yoy) across select developing and developed countries
(%)
10.0
7.6
8.0
6.6
6.0
4.9
4.3
4.0
3.2
1.8
1.7
1.6
2.0
1.3
(0.8)
0.5
(3.3)
0.1
-
(2.0)
(4.0)
Source: IMF, Angel Research
Exhibit 3: One year forward P-E ratio across select developing and developed countries
(x)
20.0
18.0
16.0
14.0
12.0
10.0
8.0
6.0
4.0
2.0
-
Source: IMF, Angel Research
Market Outlook
October 19, 2016
Exhibit 4: Relative performance of indices across globe
Returns (%)
Country
Name of index
Closing price
1M
3M
1YR
Brazil
Bovespa
63,782
10.1
12.9
34.7
Russia
Micex
1,969
(0.6)
2.8
14.7
India
Nifty
8,678
(0.6)
1.9
6.7
China
Shanghai Composite
3,084
(0.3)
1.2
(3.0)
South Africa
Top 40
44,543
(2.0)
(4.1)
(6.1)
Mexico
Mexbol
48,106
4.8
2.2
7.7
Indonesia
LQ45
937
3.2
6.4
22.1
Malaysia
KLCI
1,668
0.4
0.8
(1.5)
Thailand
SET 50
938
(0.7)
(0.6)
3.2
USA
Dow Jones
18,162
0.2
(2.1)
5.5
UK
FTSE
7,000
4.3
4.5
10.3
Japan
Nikkei
16,964
1.4
4.5
(7.4)
Germany
DAX
10,632
1.9
6.5
3.8
France
CAC
4,509
4.1
2.9
(7.0)
Source: Bloomberg, Angel Research
Stock Watch
October 19, 2016
Company Name
Reco
CMP
Target
Mkt Cap
Sales ( Čcr )
OPM(%)
EPS (Č)
PER(x)
P/BV(x)
RoE(%)
EV/Sales(x)
(Č)
Price ( Č)
( Č cr )
FY17E FY18E
FY17E
FY18E
FY17E
FY18E
FY17E
FY18E
FY17E
FY18E
FY17E
FY18E
FY17E
FY18E
Agri / Agri Chemical
Rallis
Neutral
236
-
4,591
1,937
2,164
13.3
14.3
9.0
11.0
26.2
21.5
4.6
4.0
18.4
19.8
2.4
2.1
United Phosphorus
Neutral
691
-
35,041
15,176
17,604
18.5
18.5
37.4
44.6
18.5
15.5
3.6
3.0
21.4
21.2
2.4
2.0
Auto & Auto Ancillary
Ashok Leyland
Buy
84
111
23,848
22,407
26,022
10.6
10.6
5.2
6.4
16.1
13.1
3.6
3.1
23.6
24.7
1.1
1.0
Bajaj Auto
Neutral
2,791
-
80,758
25,093
27,891
19.5
19.2
143.9
162.5
19.4
17.2
5.4
4.7
30.3
29.4
2.9
2.6
Bharat Forge
Neutral
906
-
21,090
7,726
8,713
20.5
21.2
35.3
42.7
25.7
21.2
4.7
4.3
18.9
20.1
2.8
2.4
Eicher Motors
Neutral
25,069
-
68,091
16,583
20,447
17.5
18.0
598.0
745.2
41.9
33.6
14.3
10.9
41.2
38.3
3.9
3.1
Gabriel India
Accumulate
119
130
1,706
1,544
1,715
9.0
9.3
5.4
6.3
22.0
18.9
4.2
3.7
18.9
19.5
1.1
0.9
Hero Motocorp
Neutral
3,411
-
68,103
31,253
35,198
15.3
15.0
172.3
192.1
19.8
17.8
7.3
6.2
38.9
37.0
2.1
1.8
Jamna Auto Industries Neutral
218
-
1,742
1,486
1,620
9.8
9.9
15.0
17.2
14.5
12.7
3.2
2.7
21.8
21.3
1.2
1.1
L G Balakrishnan & Bros Neutral
593
-
931
1,302
1,432
11.6
11.9
43.7
53.0
13.6
11.2
1.9
1.7
13.8
14.2
0.8
0.7
Mahindra and Mahindra Neutral
1,332
-
82,720
46,534
53,077
11.6
11.7
67.3
78.1
19.8
17.1
3.2
2.8
15.4
15.8
1.8
1.5
Maruti
Accumulate
5,626
5,998
169,952
69,186
82,217
14.7
14.4
198.5
241.4
28.3
23.3
5.5
4.5
20.2
20.0
2.2
1.7
Minda Industries
Neutral
338
-
2,682
2,728
3,042
9.0
9.1
68.2
86.2
5.0
3.9
1.1
0.9
23.8
24.3
1.0
0.9
Motherson Sumi
Neutral
332
-
46,522
45,896
53,687
7.8
8.3
13.0
16.1
25.4
20.6
8.2
6.5
34.7
35.4
1.1
0.9
Rane Brake Lining
Neutral
1,256
-
994
511
562
11.3
11.5
28.1
30.9
44.7
40.6
6.8
6.2
15.3
15.0
2.1
1.9
Setco Automotive
Neutral
42
-
563
741
837
13.0
13.0
15.2
17.0
2.8
2.5
0.5
0.4
15.8
16.3
1.1
1.0
Tata Motors
Neutral
554
-
159,821
300,209
338,549
8.9
8.4
42.7
54.3
13.0
10.2
2.1
1.8
15.6
17.2
0.6
0.6
TVS Motor
Neutral
395
-
18,785
13,390
15,948
6.9
7.1
12.8
16.5
31.0
23.9
7.7
6.1
26.3
27.2
1.4
1.2
Amara Raja Batteries
Buy
1,043
1,218
17,817
5,429
6,471
17.5
17.6
35.3
43.5
29.6
24.0
6.8
5.5
25.3
24.8
3.1
2.6
Exide Industries
Neutral
193
-
16,435
7,439
8,307
15.0
15.0
8.1
9.3
23.9
20.8
3.3
3.0
14.3
16.7
1.8
1.6
Apollo Tyres
Accumulate
220
235
11,178
12,877
14,504
14.3
13.9
21.4
23.0
10.3
9.6
1.6
1.4
16.4
15.2
1.0
1.0
Ceat
Accumulate
1,332
1,450
5,387
7,524
8,624
13.0
12.7
131.1
144.3
10.2
9.2
1.9
1.6
19.8
18.6
0.8
0.7
JK Tyres
Neutral
154
-
3,485
7,455
8,056
15.0
15.0
21.8
24.5
7.1
6.3
1.5
1.2
22.8
21.3
0.6
0.5
Swaraj Engines
Neutral
1,381
-
1,715
660
810
15.2
16.4
54.5
72.8
25.3
19.0
7.9
7.2
31.5
39.2
2.4
1.9
Subros
Neutral
135
-
809
1,488
1,681
11.7
11.9
6.4
7.2
21.1
18.8
2.2
2.0
10.8
11.4
0.8
0.7
Indag Rubber
Neutral
206
-
540
286
326
19.8
16.8
11.7
13.3
17.6
15.4
3.0
2.8
17.8
17.1
1.6
1.4
Capital Goods
ACE
Neutral
44
-
434
709
814
4.1
4.6
1.4
2.1
31.3
20.9
1.3
1.2
4.4
6.0
0.8
0.7
BEML
Buy
934
1,157
3,889
3,451
4,055
6.3
9.2
31.4
57.9
29.7
16.1
1.8
1.6
6.3
10.9
1.2
1.0
Bharat Electronics
Accumulate
1,282
1,414
30,762
8,137
9,169
16.8
17.2
58.7
62.5
21.8
20.5
3.4
3.0
44.6
46.3
2.8
2.5
Stock Watch
October 19, 2016
Company Name
Reco
CMP
Target
Mkt Cap
Sales ( Čcr )
OPM(%)
EPS (Č)
PER(x)
P/BV(x)
RoE(%)
EV/Sales(x)
(Č)
Price ( Č)
( Č cr )
FY17E
FY18E
FY17E
FY18E
FY17E
FY18E
FY17E
FY18E
FY17E
FY18E
FY17E
FY18E
FY17E
FY18E
Capital Goods
Voltas
Neutral
399
-
13,211
6,511
7,514
7.9
8.7
12.9
16.3
31.0
24.5
5.6
4.9
16.7
18.5
1.8
1.5
BGR Energy
Neutral
117
-
842
16,567
33,848
6.0
5.6
7.8
5.9
15.0
19.8
0.9
0.8
4.7
4.2
0.2
0.1
BHEL
Neutral
136
-
33,324
28,797
34,742
-
2.8
2.3
6.9
59.2
19.7
1.0
1.0
1.3
4.8
0.8
0.6
Blue Star
Accumulate
563
634
5,371
4,283
5,077
5.9
7.3
14.9
22.1
37.8
25.5
7.3
6.2
20.4
26.4
1.3
1.1
Crompton Greaves
Neutral
76
-
4,763
5,777
6,120
5.9
7.0
3.3
4.5
23.0
16.9
1.0
1.0
4.4
5.9
0.8
0.7
Greaves Cotton
Neutral
129
-
3,147
1,755
1,881
16.8
16.9
7.8
8.5
16.5
15.2
3.3
3.1
20.6
20.9
1.5
1.3
Inox Wind
Buy
227
286
5,041
5,605
6,267
15.7
16.4
24.8
30.0
9.2
7.6
2.6
1.9
25.9
24.4
0.9
0.8
KEC International
Neutral
126
-
3,235
9,294
10,186
7.9
8.1
9.9
11.9
12.7
10.6
1.9
1.6
15.6
16.3
0.6
0.5
Thermax
Neutral
887
-
10,572
5,421
5,940
7.3
7.3
25.7
30.2
34.5
29.4
4.2
3.8
12.2
13.1
1.8
1.7
VATech Wabag
Buy
539
681
2,937
3,136
3,845
8.9
9.1
26.0
35.9
20.7
15.0
2.6
2.2
13.4
15.9
0.8
0.7
Cement
ACC
Neutral
1,620
-
30,423
11,225
13,172
13.2
16.9
44.5
75.5
36.4
21.5
3.5
3.2
11.2
14.2
2.7
2.3
Ambuja Cements
Neutral
251
-
49,929
9,350
10,979
18.2
22.5
5.8
9.5
43.4
26.5
3.6
3.3
10.2
12.5
5.3
4.6
India Cements
Neutral
157
-
4,817
4,364
4,997
18.5
19.2
7.9
11.3
19.9
13.9
1.4
1.4
8.0
8.5
1.9
1.6
JK Cement
Neutral
944
-
6,598
4,398
5,173
15.5
17.5
31.2
55.5
30.2
17.0
3.6
3.2
12.0
15.5
2.0
1.7
J K Lakshmi Cement
Buy
489
565
5,758
2,913
3,412
14.5
19.5
7.5
22.5
65.3
21.8
4.0
3.4
12.5
18.0
2.6
2.1
Orient Cement
Buy
184
215
3,776
2,114
2,558
18.5
20.5
8.1
11.3
22.8
16.3
3.4
2.8
9.0
14.0
2.4
1.9
UltraTech Cement
Neutral
4,015
-
110,194
25,768
30,385
21.0
23.5
111.0
160.0
36.2
25.1
4.6
4.0
13.5
15.8
4.4
3.6
Construction
ITNL
Neutral
104
-
3,410
8,946
10,017
31.0
31.6
8.1
9.1
12.8
11.4
0.5
0.5
4.2
5.0
3.7
3.4
KNR Constructions
Neutral
781
-
2,197
1,385
1,673
14.7
14.0
41.2
48.5
19.0
16.1
3.5
3.1
14.9
15.2
1.7
1.4
Larsen & Toubro
Accumulate
1,489
1,700
138,729
67,665
77,249
10.7
11.5
57.3
71.2
26.0
20.9
2.4
2.2
12.6
14.3
2.2
1.9
Gujarat Pipavav Port
Neutral
170
-
8,228
705
788
52.2
51.7
5.0
5.6
34.0
30.4
3.4
3.0
11.2
11.2
11.3
9.6
Nagarjuna Const.
Neutral
82
-
4,545
8,842
9,775
9.1
8.8
5.3
6.4
15.4
12.8
1.2
1.1
8.2
9.1
0.7
0.6
PNC Infratech
Accumulate
125
143
3,203
2,350
2,904
13.1
13.2
9.0
8.8
13.9
14.2
0.5
0.5
15.9
13.9
1.5
1.2
Simplex Infra
Neutral
322
-
1,595
6,829
7,954
10.5
10.5
31.4
37.4
10.3
8.6
1.1
1.0
9.9
13.4
0.7
0.6
Power Mech Projects
Neutral
490
-
721
1,801
2,219
12.7
14.6
72.1
113.9
6.8
4.3
1.3
1.1
16.8
11.9
0.4
0.3
Sadbhav Engineering
Accumulate
274
298
4,707
3,598
4,140
10.3
10.6
9.0
11.9
30.5
23.1
3.2
2.8
9.9
11.9
1.6
1.4
NBCC
Neutral
253
-
15,159
7,428
9,549
7.9
8.6
8.2
11.0
30.8
23.0
1.5
1.2
28.2
28.7
1.8
1.3
MEP Infra
Neutral
44
-
707
1,877
1,943
30.6
29.8
3.0
4.2
14.5
10.4
7.0
4.7
0.6
0.6
1.8
1.6
SIPL
Neutral
109
-
3,834
1,036
1,252
65.5
66.2
(8.4)
(5.6)
4.1
4.7
(22.8)
(15.9)
11.9
9.9
Stock Watch
October 19, 2016
Company Name
Reco
CMP
Target
Mkt Cap
Sales ( Čcr )
OPM(%)
EPS (Č)
PER(x)
P/BV(x)
RoE(%)
EV/Sales(x)
(Č)
Price ( Č)
( Č cr )
FY17E
FY18E
FY17E
FY18E
FY17E
FY18E
FY17E
FY18E
FY17E
FY18E
FY17E
FY18E
FY17E
FY18E
Construction
Engineers India
Neutral
263
-
8,861
1,725
1,935
16.0
19.1
11.4
13.9
23.1
18.9
3.2
3.1
13.4
15.3
4.1
3.6
Financials
Axis Bank
Buy
532
630
127,047
46,932
53,575
3.5
3.4
32.4
44.6
16.5
11.9
2.1
1.8
13.6
16.5
-
-
Bank of Baroda
Neutral
156
-
35,864
19,980
23,178
1.8
1.8
11.5
17.3
13.5
9.0
1.6
1.3
8.3
10.1
-
-
Canara Bank
Neutral
314
-
17,064
15,225
16,836
1.8
1.8
14.5
28.0
21.7
11.2
1.5
1.2
5.8
8.5
-
-
Dewan Housing Finance Accumulate
324
350
9,456
2,225
2,688
2.9
2.9
29.7
34.6
10.9
9.4
1.8
1.5
16.1
16.8
-
-
Equitas Holdings
Buy
179
235
6,015
939
1,281
11.7
11.5
5.8
8.2
30.9
21.9
2.7
2.4
10.9
11.5
-
-
Federal Bank
Neutral
72
-
12,337
9,353
10,623
2.9
2.9
4.4
5.8
16.3
12.4
1.6
1.4
9.5
11.0
-
-
HDFC
Neutral
1,352
-
213,715
11,475
13,450
3.4
3.4
45.3
52.5
29.8
25.8
5.8
5.1
20.2
20.5
-
-
HDFC Bank
Accumulate
1,257
1,350
318,341
46,097
55,433
4.5
4.5
58.4
68.0
21.5
18.5
3.8
3.2
18.8
18.6
-
-
ICICI Bank
Neutral
270
-
157,290
39,029
45,903
3.3
3.3
16.7
16.3
16.2
16.6
2.0
1.8
10.1
12.4
-
-
LIC Housing Finance
Neutral
613
-
30,938
3,712
4,293
2.6
2.5
39.0
46.0
15.7
13.3
3.0
2.5
19.9
20.1
-
-
Punjab Natl.Bank
Neutral
141
-
29,930
23,532
23,595
2.3
2.4
6.8
12.6
20.7
11.2
3.2
2.3
3.3
6.5
-
-
RBL Bank
Buy
307
365
11,370
1,783
2,309
2.6
2.6
12.7
16.4
24.2
18.8
2.6
2.4
12.8
13.3
-
-
South Ind.Bank
Neutral
24
-
3,207
6,435
7,578
2.5
2.5
2.7
3.1
8.8
7.7
1.1
1.0
10.1
11.2
-
-
St Bk of India
Neutral
257
-
199,426
88,650
98,335
2.6
2.6
13.5
18.8
19.0
13.7
1.8
1.6
7.0
8.5
-
-
Union Bank
Neutral
143
-
9,844
13,450
14,925
2.3
2.3
25.5
34.5
5.6
4.2
0.8
0.7
7.5
10.2
-
-
Yes Bank
Neutral
1,291
-
54,363
8,978
11,281
3.3
3.4
74.0
90.0
17.5
14.4
3.3
2.8
17.0
17.2
-
-
FMCG
Asian Paints
Neutral
1,177
-
112,912
17,128
18,978
16.8
16.4
19.1
20.7
61.6
56.9
21.4
20.2
34.8
35.5
6.5
5.9
Britannia
Accumulate
3,269
3,626
39,216
9,795
11,040
14.6
14.9
80.3
94.0
40.7
34.8
16.7
12.9
41.2
-
3.9
3.4
Colgate
Accumulate
918
995
24,979
4,605
5,149
23.4
23.4
23.8
26.9
38.6
34.1
21.4
16.7
64.8
66.8
5.4
4.8
Dabur India
Accumulate
275
304
48,403
8,315
9,405
19.8
20.7
8.1
9.2
34.0
29.9
9.5
7.8
31.6
31.0
5.5
4.8
GlaxoSmith Con*
Neutral
6,220
-
26,159
4,350
4,823
21.2
21.4
179.2
196.5
34.7
31.7
9.2
7.8
27.1
26.8
5.4
4.8
Godrej Consumer
Neutral
1,591
-
54,172
10,235
11,428
18.4
18.6
41.1
44.2
38.7
36.0
8.6
7.2
24.9
24.8
5.4
4.8
HUL
Neutral
855
-
184,946
35,252
38,495
17.6
17.4
20.4
21.9
41.8
39.0
34.4
30.2
82.2
77.3
5.1
4.6
ITC
Buy
246
283
296,701
40,059
44,439
39.0
39.2
9.1
10.1
27.0
24.4
7.4
6.5
27.2
26.5
6.9
6.2
Marico
Accumulate
284
300
36,576
6,430
7,349
18.8
19.5
6.4
7.7
44.3
36.8
13.4
11.3
33.2
32.5
5.5
4.8
Nestle*
Neutral
6,825
-
65,804
10,073
11,807
20.7
21.5
124.8
154.2
54.7
44.3
22.5
20.2
34.8
36.7
6.3
5.4
Tata Global
Neutral
152
-
9,587
8,675
9,088
9.8
9.8
7.4
8.2
20.5
18.5
2.3
2.2
7.9
8.1
1.0
1.0
Procter & Gamble
Accumulate
6,980
7,369
22,658
2,939
3,342
23.2
23.0
146.2
163.7
47.7
42.6
106.9
102.5
25.3
23.5
7.3
6.3
Hygiene
Stock Watch
October 19, 2016
Company Name
Reco
CMP
Target
Mkt Cap
Sales ( Čcr )
OPM(%)
EPS (Č)
PER(x)
P/BV(x)
RoE(%)
EV/Sales(x)
(Č)
Price ( Č)
( Č cr )
FY17E FY18E
FY17E
FY18E
FY17E
FY18E
FY17E
FY18E
FY17E
FY18E
FY17E
FY18E
FY17E
FY18E
IT
HCL Tech^
Buy
834
1,000
117,692
49,242
57,168
20.5
20.5
55.7
64.1
15.0
13.0
3.0
2.3
20.3
17.9
2.3
1.8
Infosys
Buy
1,038
1,370
238,469
69,934
79,025
27.5
27.5
64.8
72.0
16.0
14.4
3.5
3.2
22.0
22.3
2.9
2.5
TCS
Buy
2,398
3,004
472,568
121,684
136,286
27.3
27.3
135.0
150.1
17.8
16.0
5.9
5.4
33.2
33.9
3.7
3.2
Tech Mahindra
Buy
426
700
41,308
30,347
33,685
17.0
17.0
37.5
41.3
11.4
10.3
2.5
2.1
21.8
20.7
1.1
0.9
Wipro
Buy
481
680
117,003
51,631
55,822
21.7
17.9
35.9
36.9
13.4
13.0
2.8
2.6
19.0
18.1
2.0
1.7
Media
D B Corp
Neutral
396
-
7,273
2,297
2,590
27.4
28.2
21.0
23.4
18.9
16.9
4.4
3.8
23.7
23.1
3.0
2.6
HT Media
Neutral
90
-
2,083
2,693
2,991
12.6
12.9
7.9
9.0
11.3
9.9
1.0
0.9
7.8
8.3
0.4
0.2
Jagran Prakashan
Accumulate
198
225
6,488
2,355
2,635
28.0
28.0
10.8
12.5
18.4
15.9
4.0
3.4
21.7
21.7
2.8
2.4
Sun TV Network
Neutral
544
-
21,428
2,850
3,265
70.1
71.0
26.2
30.4
20.8
17.9
5.3
4.7
24.3
25.6
7.1
6.1
Hindustan Media
Neutral
298
-
2,190
1,016
1,138
24.3
25.2
27.3
30.1
10.9
9.9
2.1
1.9
16.2
15.8
1.5
1.3
Ventures
TV Today Network
Accumulate
330
363
1,969
637
743
27.5
27.5
18.4
21.4
18.0
15.4
3.1
2.7
17.4
17.2
2.7
2.2
Metals & Mining
Coal India
Neutral
313
-
197,418
84,638
94,297
21.4
22.3
24.5
27.1
12.8
11.5
5.3
5.1
42.6
46.0
1.8
1.7
Hind. Zinc
Neutral
245
-
103,457
14,252
18,465
55.9
48.3
15.8
21.5
15.5
11.4
2.5
2.2
17.0
20.7
7.3
5.6
Hindalco
Neutral
152
-
31,429
107,899
112,095
7.4
8.2
9.2
13.0
16.5
11.7
0.8
0.8
4.8
6.6
0.8
0.8
JSW Steel
Neutral
1,781
-
43,045
53,201
58,779
16.1
16.2
130.6
153.7
13.6
11.6
1.8
1.6
14.0
14.4
1.6
1.4
NMDC
Neutral
117
-
46,229
6,643
7,284
44.4
47.7
7.1
7.7
16.4
15.1
1.4
1.4
8.8
9.2
4.7
4.3
SAIL
Neutral
49
-
20,052
47,528
53,738
(0.7)
2.1
(1.9)
2.6
18.7
0.5
0.5
(1.6)
3.9
1.3
1.2
Vedanta
Neutral
196
-
58,227
71,744
81,944
19.2
21.7
13.4
20.1
14.7
9.8
1.3
1.1
8.4
11.3
1.2
0.9
Tata Steel
Neutral
425
-
41,267
121,374
121,856
7.2
8.4
18.6
34.3
22.8
12.4
1.4
1.3
6.1
10.1
1.0
1.0
Oil & Gas
Cairn India
Neutral
224
-
42,025
9,127
10,632
4.3
20.6
8.8
11.7
25.5
19.2
0.8
0.8
3.3
4.2
6.1
5.0
GAIL
Neutral
429
-
54,475
56,220
65,198
9.3
10.1
27.1
33.3
15.9
12.9
1.5
1.4
9.3
10.7
1.2
1.0
ONGC
Neutral
276
-
236,431
137,222
152,563
15.0
21.8
19.5
24.1
14.2
11.5
1.2
1.1
8.5
10.1
2.0
1.8
Indian Oil Corp
Neutral
322
-
156,214
373,359
428,656
5.9
5.5
54.0
59.3
6.0
5.4
0.9
0.8
16.0
15.6
0.6
0.5
Reliance Industries
Neutral
1,079
-
349,957
301,963
358,039
12.1
12.6
87.7
101.7
12.3
10.6
1.3
1.2
10.7
11.3
1.6
1.4
Pharmaceuticals
Alembic Pharma
Neutral
674
-
12,697
3,483
4,083
20.2
21.4
24.3
30.4
27.7
22.2
6.3
5.0
25.5
25.3
3.6
3.0
Aurobindo Pharma
Accumulate
834
877
48,794
15,720
18,078
23.7
23.7
41.4
47.3
20.1
17.6
5.2
4.1
29.6
26.1
3.3
2.9
Aventis*
Neutral
4,240
-
9,765
2,357
2,692
17.3
17.3
153.5
169.2
27.6
25.1
4.7
3.8
25.8
28.4
3.8
3.1
Cadila Healthcare
Neutral
394
-
40,295
11,126
13,148
22.0
22.0
17.1
20.0
23.0
19.7
5.9
4.7
28.8
26.6
3.6
3.0
Cipla
Sell
591
490
47,507
15,378
18,089
17.4
18.4
21.6
27.2
27.4
21.7
3.5
3.1
13.7
15.2
3.3
2.7
Stock Watch
October 19, 2016
Company Name
Reco
CMP
Target
Mkt Cap
Sales ( Čcr )
OPM(%)
EPS (Č)
PER(x)
P/BV(x)
RoE(%)
EV/Sales(x)
(Č)
Price ( Č)
( Č cr )
FY17E FY18E
FY17E
FY18E
FY17E
FY18E
FY17E
FY18E
FY17E
FY18E
FY17E
FY18E
FY17E
FY18E
Pharmaceuticals
Dr Reddy's
Neutral
3,044
-
50,444
16,043
18,119
23.1
24.7
126.0
157.8
24.2
19.3
3.6
3.1
15.7
17.1
3.1
2.7
Dishman Pharma
Sell
241
45
3,888
1,718
1,890
22.7
22.8
9.5
11.3
25.4
21.3
2.5
2.2
10.1
10.9
2.7
2.4
GSK Pharma*
Neutral
2,972
-
25,172
3,528
3,811
16.6
18.8
51.8
59.4
57.4
50.0
15.4
15.3
26.3
30.6
6.9
6.4
Indoco Remedies
Sell
311
225
2,864
1,112
1,289
18.2
18.2
13.2
15.6
23.6
19.9
4.2
3.6
19.2
19.2
2.7
2.3
Ipca labs
Neutral
619
-
7,805
3,303
3,799
15.3
15.3
17.3
19.7
35.8
31.4
3.1
2.9
9.1
9.4
2.5
2.2
Lupin
Buy
1,482
1,809
66,803
15,912
18,644
26.4
26.7
58.1
69.3
25.5
21.4
5.0
4.1
21.4
20.9
4.3
3.5
Sun Pharma
Buy
744
944
179,046
31,129
35,258
30.0
30.9
28.0
32.8
26.6
22.7
4.1
3.4
18.7
18.9
5.3
4.5
Power
Tata Power
Neutral
79
-
21,299
36,916
39,557
17.4
27.1
5.1
6.3
15.4
12.5
1.4
1.3
9.0
10.3
1.6
1.4
NTPC
Neutral
148
-
121,868
86,605
95,545
17.5
20.8
11.8
13.4
12.5
11.0
1.3
1.2
10.5
11.1
2.7
2.8
Power Grid
Neutral
176
-
92,259
25,763
29,762
74.3
73.1
14.8
17.3
11.9
10.2
1.9
1.6
16.9
17.5
7.9
7.5
Real Estate
Prestige Estate
Accumulate
195
210
7,320
4,707
5,105
25.2
26.0
10.3
13.0
19.0
15.0
1.5
1.4
10.3
10.2
2.7
2.4
MLIFE
Buy
437
522
1,794
1,152
1,300
22.7
24.6
29.9
35.8
14.6
12.2
1.1
1.0
7.6
8.6
2.3
1.9
Telecom
Bharti Airtel
Neutral
306
-
122,480
105,086
114,808
34.5
34.7
12.2
16.4
25.1
18.7
1.7
1.6
6.8
8.4
2.1
1.8
Idea Cellular
Neutral
73
-
26,286
40,133
43,731
37.2
37.1
6.4
6.5
11.4
11.2
1.0
0.9
8.2
7.6
1.7
1.4
zOthers
Abbott India
Neutral
4,743
-
10,079
3,153
3,583
14.1
14.4
152.2
182.7
31.2
26.0
153.0
130.7
25.6
26.1
2.9
2.5
Asian Granito
Buy
277
351
834
1,118
1,220
11.8
12.0
13.0
16.0
21.3
17.4
2.1
1.9
9.7
10.7
1.0
0.9
Bajaj Electricals
Buy
257
306
2,601
5,099
5,805
5.6
5.9
11.4
14.6
22.6
17.7
3.0
2.7
13.4
15.1
0.5
0.4
Banco Products (India)
Neutral
227
-
1,622
1,353
1,471
12.3
12.4
14.5
16.3
15.6
13.9
21.6
19.5
14.5
14.6
1.1
122.5
Coffee Day Enterprises
Neutral
227
-
4,671
2,964
3,260
20.5
21.2
4.7
8.0
-
28.3
2.6
2.4
5.5
8.5
2.0
1.8
Ltd
Competent Automobiles Neutral
193
-
118
1,137
1,256
3.1
2.7
28.0
23.6
6.9
8.2
37.0
33.5
14.3
11.5
0.1
0.1
Elecon Engineering
Neutral
71
-
768
1,482
1,660
13.7
14.5
3.9
5.8
18.1
12.2
4.3
3.9
7.8
10.9
0.8
0.7
Finolex Cables
Neutral
434
-
6,638
2,883
3,115
12.0
12.1
14.2
18.6
30.6
23.3
16.3
14.2
15.8
14.6
2.0
1.8
Garware Wall Ropes
Neutral
526
-
1,151
873
938
12.9
13.1
30.9
34.9
17.0
15.1
2.7
2.3
15.7
15.2
1.2
1.1
Goodyear India*
Neutral
824
-
1,900
1,598
1,704
10.4
10.2
49.4
52.6
16.7
15.7
77.0
67.5
18.2
17.0
0.9
123.7
Hitachi
Neutral
1,552
-
4,220
2,081
2,433
8.8
8.9
33.4
39.9
46.5
38.9
37.5
31.2
22.1
21.4
2.0
1.7
HSIL
Neutral
355
-
2,568
2,384
2,515
15.8
16.3
15.3
19.4
23.2
18.3
23.1
19.9
7.8
9.3
1.2
1.1
Interglobe Aviation
Neutral
938
-
33,809
21,122
26,005
14.5
27.6
110.7
132.1
8.5
7.1
50.7
36.2
168.5
201.1
1.6
1.2
Jyothy Laboratories
Neutral
359
-
6,511
1,440
2,052
11.5
13.0
8.5
10.0
42.2
35.9
10.2
9.5
18.6
19.3
4.8
3.3
Kirloskar Engines India
Neutral
351
-
5,075
2,554
2,800
9.9
10.0
10.5
12.1
33.4
29.0
14.0
13.2
10.7
11.7
1.6
1.4
Ltd
Stock Watch
October 19, 2016
Company Name
Reco
CMP
Target
Mkt Cap
Sales ( Čcr )
OPM(%)
EPS (Č)
PER(x)
P/BV(x)
RoE(%)
EV/Sales(x)
(Č)
Price ( Č)
( Č cr )
FY17E
FY18E
FY17E
FY18E
FY17E
FY18E
FY17E
FY18E
FY17E
FY18E
FY17E
FY18E
FY17E
FY18E
zOthers
Linc Pen & Plastics
Neutral
262
-
388
382
420
9.3
9.5
13.5
15.7
19.5
16.7
3.3
2.9
17.1
17.3
1.1
1.0
M M Forgings
Neutral
460
-
555
546
608
20.4
20.7
41.3
48.7
11.2
9.4
63.0
55.8
16.6
17.0
0.9
0.8
Manpasand Bever.
Neutral
723
-
4,135
836
1,087
19.6
19.4
16.9
23.8
42.8
30.4
5.1
4.5
12.0
14.8
4.7
3.5
Mirza International
Buy
94
113
1,131
1,024
1,148
18.0
18.0
6.9
8.0
13.6
11.8
2.3
1.9
16.6
16.2
1.3
1.1
MT Educare
Neutral
134
-
532
366
417
17.7
18.2
9.4
10.8
14.3
12.4
3.2
2.8
22.2
22.3
1.4
1.2
Narayana Hrudaya
Neutral
356
-
7,272
1,873
2,166
11.5
11.7
2.6
4.0
134.5
89.8
8.3
7.5
6.1
8.3
4.0
3.4
Navkar Corporation
Buy
199
265
2,840
408
612
42.9
42.3
6.8
11.5
29.4
17.3
2.0
1.8
6.9
10.5
7.9
5.3
Navneet Education
Neutral
101
-
2,399
1,062
1,147
24.0
24.0
6.1
6.6
16.5
15.2
3.4
3.0
20.6
19.8
2.3
2.2
Nilkamal
Neutral
1,671
-
2,494
1,995
2,165
10.7
10.4
69.8
80.6
23.9
20.7
95.5
82.9
16.6
16.5
1.2
1.1
Page Industries
Neutral
16,412
-
18,306
2,450
3,124
20.1
17.6
299.0
310.0
54.9
52.9
365.5
279.0
47.1
87.5
7.5
5.9
Parag Milk Foods
Neutral
319
-
2,680
1,919
2,231
9.3
9.6
9.5
12.9
33.7
24.6
5.2
4.3
15.5
17.5
1.6
1.3
Quick Heal
Neutral
254
-
1,777
408
495
27.3
27.0
7.7
8.8
32.8
28.9
3.0
3.1
9.3
10.6
3.5
2.9
Radico Khaitan
Neutral
141
-
1,881
1,659
1,802
13.0
13.2
6.3
7.4
22.3
19.2
1.9
1.8
8.6
9.3
1.6
1.4
Relaxo Footwears
Neutral
437
-
5,248
2,085
2,469
9.2
8.2
7.6
8.0
57.8
55.0
22.4
19.1
17.9
18.8
2.6
2.2
S H Kelkar & Co.
Neutral
300
-
4,341
1,036
1,160
15.1
15.0
6.1
7.2
49.2
41.8
5.3
4.8
10.7
11.5
4.1
3.6
Siyaram Silk Mills
Accumulate
1,531
1,714
1,435
1,799
2,040
11.6
11.7
104.9
122.4
14.6
12.5
2.4
2.1
16.4
16.4
1.0
0.9
Styrolution ABS India*
Neutral
606
-
1,065
1,440
1,537
9.2
9.0
40.6
42.6
14.9
14.2
38.1
34.6
12.3
11.6
0.7
0.6
Surya Roshni
Neutral
229
-
1,006
3,342
3,625
7.8
7.5
17.3
19.8
13.3
11.6
25.2
20.2
10.5
10.8
0.6
0.5
Team Lease Serv.
Neutral
1,008
-
1,723
3,229
4,001
1.5
1.8
22.8
32.8
44.3
30.7
4.7
4.1
10.7
13.4
0.4
0.3
The Byke Hospitality
Neutral
185
-
741
287
384
20.5
20.5
7.6
10.7
24.3
17.3
5.1
4.1
20.7
23.5
2.6
1.9
Transport Corporation of
Neutral
180
-
1,377
2,671
2,911
8.5
8.8
13.9
15.7
13.0
11.5
1.8
1.6
13.7
13.8
0.6
0.6
India
TVS Srichakra
Neutral
3,844
-
2,943
2,304
2,614
13.7
13.8
231.1
266.6
16.6
14.4
431.9
340.1
33.9
29.3
1.3
1.1
UFO Moviez
Neutral
452
-
1,248
619
685
33.2
33.4
30.0
34.9
15.1
13.0
2.1
1.8
13.8
13.9
1.7
1.4
Visaka Industries
Neutral
216
-
342
1,051
1,138
10.3
10.4
21.0
23.1
10.3
9.3
27.7
25.9
9.0
9.2
0.6
0.6
VRL Logistics
Neutral
318
-
2,897
1,902
2,119
16.7
16.6
14.6
16.8
21.8
18.9
4.8
4.2
21.9
22.2
1.6
1.4
Wonderla Holidays
Neutral
407
-
2,297
287
355
38.0
40.0
11.3
14.2
36.0
28.6
5.2
4.5
21.4
23.9
7.7
6.2
Source: Company, Angel Research; Note: *December year end; #September year end; &October year end; Price as on October 18, 2016
Market Outlook
October 19, 2016
Research Team Tel: 022 - 39357800
DISCLAIMER
Angel Broking Private Limited (hereinafter referred to as “Angel”) is a registered Member of National Stock Exchange of India
Limited,Bombay Stock Exchange Limited and Metropolitan Stock Exchange Limited. It is also registered as a Depository Participant with
CDSL and Portfolio Manager with SEBI. It also has registration with AMFI as a Mutual Fund Distributor. Angel Broking Private Limited is a
registered entity with SEBI for Research Analyst in terms of SEBI (Research Analyst) Regulations, 2014 vide registration number
INH000000164. Angel or its associates has not been debarred/ suspended by SEBI or any other regulatory authority for accessing
/dealing in securities Market. Angel or its associates/analyst has not received any compensation / managed or
co-managed public offering of securities of the company covered by Analyst during the past twelve months.
This document is solely for the personal information of the recipient, and must not be singularly used as the basis of any investment
decision. Nothing in this document should be construed as investment or financial advice. Each recipient of this document should make
such investigations as they deem necessary to arrive at an independent evaluation of an investment in the securities of the companies
referred to in this document (including the merits and risks involved), and should consult their own advisors to determine the merits and
risks of such an investment.
Reports based on technical and derivative analysis center on studying charts of a stock's price movement, outstanding positions and
trading volume, as opposed to focusing on a company's fundamentals and, as such, may not match with a report on a company's
fundamentals. Investors are advised to refer the Fundamental and Technical Research Reports available on our website to evaluate the
contrary view, if any.
The information in this document has been printed on the basis of publicly available information, internal data and other reliable
sources believed to be true, but we do not represent that it is accurate or complete and it should not be relied on as such, as this
document is for general guidance only. Angel Broking Pvt. Limited or any of its affiliates/ group companies shall not be in any way
responsible for any loss or damage that may arise to any person from any inadvertent error in the information contained in this report.
Angel Broking Pvt. Limited has not independently verified all the information contained within this document. Accordingly, we cannot
testify, nor make any representation or warranty, express or implied, to the accuracy, contents or data contained within this document.
While Angel Broking Pvt. Limited endeavors to update on a reasonable basis the information discussed in this material, there may be
regulatory, compliance, or other reasons that prevent us from doing so.
This document is being supplied to you solely for your information, and its contents, information or data may not be reproduced,
redistributed or passed on, directly or indirectly.
Neither Angel Broking Pvt. Limited, nor its directors, employees or affiliates shall be liable for any loss or damage that may arise from
or in connection with the use of this information.